The Coming Showing Surge Is Real
January 5, 2026
January 5, 2026
January 5, 2026
The 1st Quarter Showing Surge Is Real (and We’re Going to Use It)
Every year Colorado does the same little magic trick.
Showings fall off a cliff in late November and December because people are busy traveling, eating, and pretending January is “next year’s problem.” Then the holidays end, buyers wake up, and showing activity snaps back fast, typically climbing through January and February and hitting premium levels by March. In many years, that March peak runs roughly 50% higher than slower parts of the year.
That’s not a vibe. That’s a measurable demand curve.
So if you’re selling in Q1, the goal isn’t to “list and hope.” The goal is to time the wave and price for momentum.
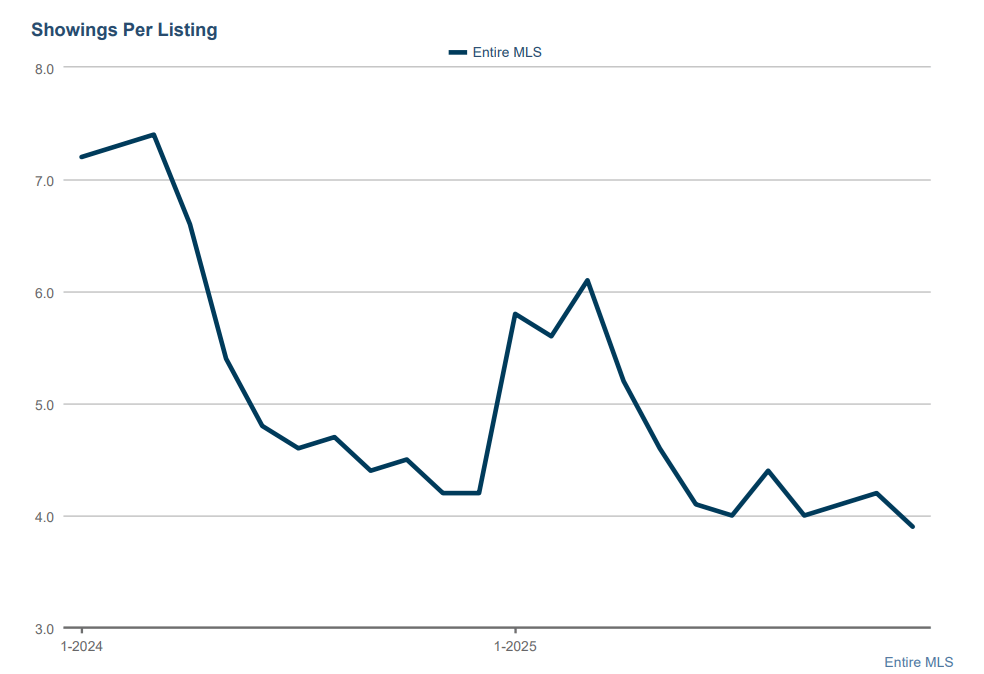
The opportunity: February is when serious buyers start acting
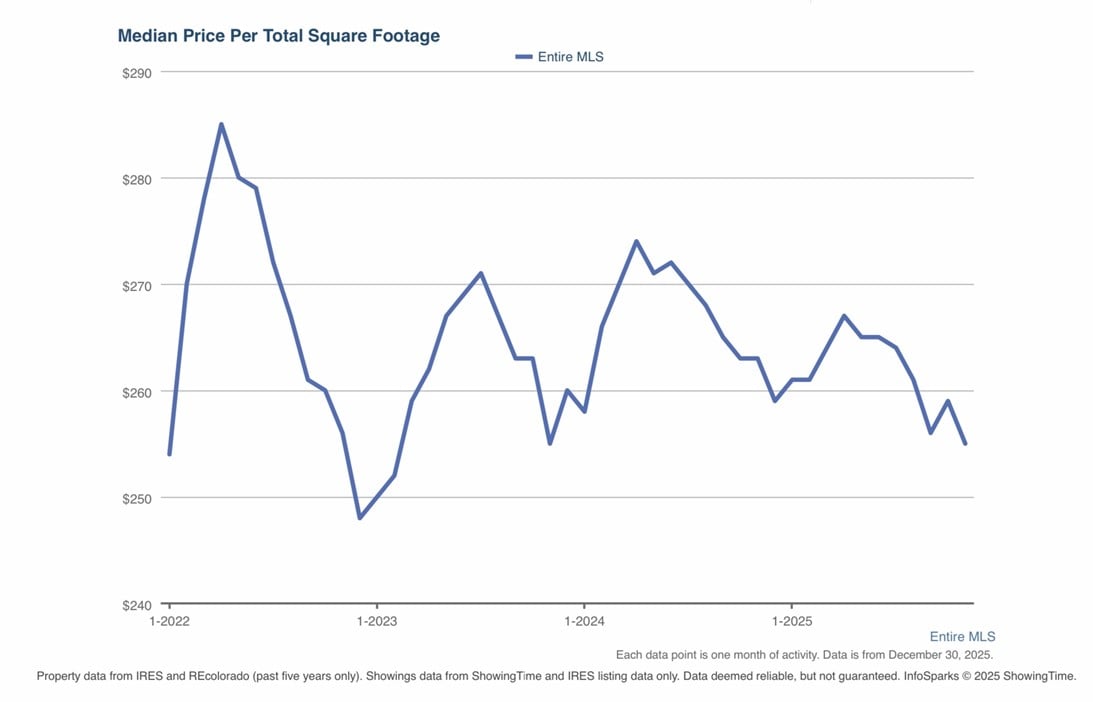
The chart tells a consistent story:
This is why Q1 is one of the best quarters to sell. Not because it’s pretty outside. Because more buyers are in motion at the same time, and that’s what creates competition.
Competition is what pays you.
Two key metrics that predict a sale
You can argue about paint colors all day. The market doesn’t care. The market answers one question:
1) Showing velocity (showings per week)
A simple rule of thumb: it often takes about 10 showings to produce a sale, assuming the home is positioned correctly.
If a home is going to sell in 30–60 days, it needs a steady flow of traffic. That usually means:
No showings = no offers. It’s like fishing without putting bait on the hook.
2) Conversion rate (showings that turn into offers)
Traffic is step one. Conversion is step two.
If you’re getting showings but no offers, one of three things is happening:
We watch this closely because it tells us whether to fix presentation, adjust terms, or adjust price.
Our Q1 strategy: price for momentum, then go full MLS when the metrics prove it
Here’s the strategy I recommend for homeowners selling this quarter:
Step 1: Build a listing that wins on the internet
Buyers decide whether to tour your home in about 8 seconds.
So we start with:
Step 2: Pre-market to validate pricing and create demand
Before we do the full MLS blast, we can syndicate and test the market response to gauge buyer behavior and fine-tune pricing.
Why this matters:
Step 3: Price to hit a minimum of 2 showings per week by February
This is the heart of the plan.
If we are not getting at least two showings per week in February, the market is telling us something. And it’s never subtle.
So we price with one goal: create showing velocity.
Not “leave room to negotiate.”
Not “try it high.”
Not “because my neighbor said.”
Velocity.
Step 4: Go live in the MLS once the showing metrics confirm the price
When the activity supports the price, we go full MLS and leverage the Q1 surge.
That’s when the buyer pool is expanding weekly, and competition has the best chance of doing what we want:
Step 5: If the metrics lag, we adjust fast (not later)
The biggest mistake sellers make is waiting too long to react.
If the market says we’re overpriced, we don’t “give it time.” Time is what turns a good listing into a stale one.
A smart adjustment early often nets more than a slow bleed over 60 days.
What you should expect if this plan is working
By early-to-mid February, a well-positioned listing should show signs of life:
If we don’t see that, we don’t panic. We diagnose and fix the cause.
The bottom line
Q1 is not the time to “test the market.”
It’s the time to exploit the demand curve.
Our job is to position your home, so buyers compete, and the cleanest way to do that is to price for at least two showings per week beginning in February, then go full MLS when the numbers prove we’re in the strike zone.
Thanks, Grant
Stay up to date on the latest real estate trends.

Real Estate
April 15-21

April 8-14, 2026


Real Estate
125 Mesa Way | Strategy. Execution. Outcome.
Visual Positioning

Real Estate
And Denver Is Right in the Middle

Overview

A Market Taking Shape
Dolby Haas has established a reputation for outstanding performance including several recording-breaking sales from Northern Colorado Springs, Evergreen, Greater Denver, and Broomfield. Contact him today!